
Kelly Criterion Trading: A Position Sizing Guide for Traders


The Kelly Criterion tells you the exact fraction of your capital to risk on a trade so that your account compounds at the fastest possible long-term rate. The trading version of the formula is f = W − (1 − W) / R*, where W is your historical win rate and R is your average reward-to-risk ratio.
That single equation looks harmless. In practice it often spits out position sizes of 20% or more per trade, which is far too aggressive for anyone trading real money on estimated stats.
Three things to know before you touch the formula:
Estimation error is the real risk. Kelly assumes you know your true edge; you never do, you only have a sample.
Trade returns aren’t independent. Market conditions cluster, so the “repeatable, independent bet” assumption behind Kelly gets stretched thin.
Full Kelly is a ceiling, not a target. Most professional traders run a quarter or half of what the formula recommends, a point the Kelly criterion formulation itself doesn’t warn you about but practitioners learned the hard way.
Key Takeaways
Kelly sizing works only when traders shrink their edge estimates, run a fraction of the formula’s output, and enforce hard caps regardless of what the math suggests.
Point | Details |
Use the trading formula | f* = W − (1 − W) / R converts win rate and reward-to-risk directly into a risk fraction. |
Never run full Kelly live | Half or quarter Kelly keeps most of the growth rate while cutting drawdown risk sharply. |
Distrust small samples | Under 50 trades, shrink estimates heavily or skip Kelly for fixed-percentage risk instead. |
Watch correlation | Correlated positions should be capped as one combined risk, not summed individually. |
Automate enforcement | Discipline AI tracks W and R from trade history and enforces position-size caps automatically. |
Table of Contents
What Is Kelly Position Sizing and When Does It Apply?
Kelly position sizing answers one question: given an edge, how much of your bankroll should ride on each play to grow your capital fastest over many repetitions? The math optimizes for expected log wealth rather than expected dollar return, which matters more than it sounds.
Maximizing expected value in raw dollars can lead you to bet your whole account on a favorable coin flip. Maximizing the logarithm of wealth accounts for compounding and the fact that a 50% loss requires a 100% gain to recover. That’s the entire reason Kelly exists instead of just betting max size on every positive-expectancy trade.
Kelly position sizing makes the most sense when a few conditions hold:
You’re trading a setup that repeats often enough to generate a real sample (dozens to hundreds of instances).
The instrument has defined, bounded risk, like a stock, future, or spot crypto position with a hard stop.
You’ve verified the edge isn’t a statistical fluke from a small or cherry-picked dataset.
Where it breaks down: undefined-risk positions (naked short options, for instance), heavy transaction costs that eat into R, and any setup where returns aren’t roughly independent from one trade to the next, such as correlated trades placed during the same volatility spike. Leverage and margin requirements also change the math, since borrowed capital changes your effective bankroll and your actual downside.
The Kelly Criterion Formula, Trading Variant, and Portfolio Case
The original binary-bet formula from Kelly’s 1956 paper is:
f = (bp − q) / b*
Here, p is your probability of winning, q is 1 − p, and b is the net odds received on a win (a 2:1 payout means b = 2). This form comes straight from Kelly’s original formulation, built for scenarios with a known, fixed payout structure like a fair bet at posted odds.
Trading doesn’t hand you clean odds, so practitioners translate the formula into terms drawn from a trade log:
f = W − (1 − W) / R*
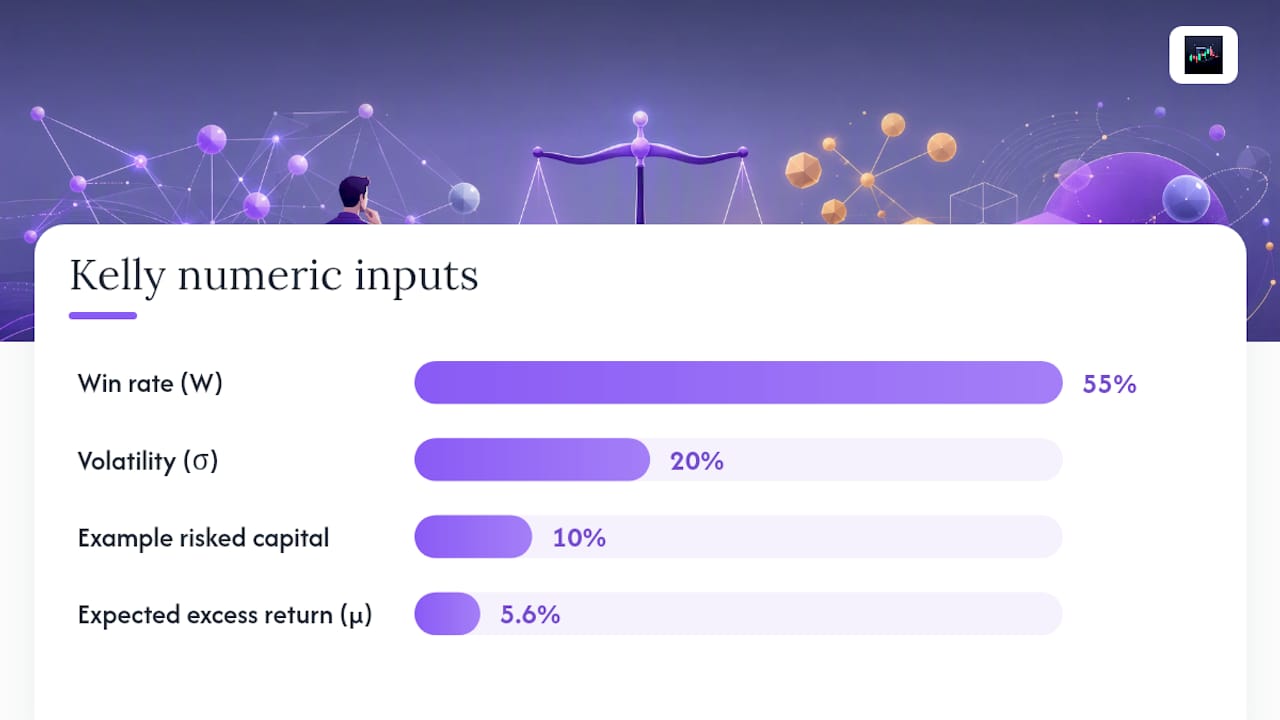
W is your win rate, expressed as a decimal (a 55% win rate is W = 0.55).
R is your reward-to-risk ratio: average winning trade size divided by average losing trade size.
f* is the fraction of capital to risk on the next trade, not the fraction to allocate to the position itself.
That distinction trips people up constantly. To convert that into an actual position size, divide the dollar amount you’re willing to risk by the dollar distance from entry to stop, then divide again by the value each contract, share, or coin moves per point. A $50,000 account risking 10% ($5,000) on a stock with a $2 stop translates to 2,500 shares, before you account for fees.
For portfolios or continuous return streams instead of discrete bets, Kelly takes a different shape. The rough continuous approximation is:
p ≈ μ / σ², where μ is expected excess return and σ² is variance.
Plug in typical equity market numbers, say μ near 5.6% and σ near 20%, and this approximation can imply an allocation north of 100%, a leverage level almost nobody should actually run, as the Berkeley analysis of Kelly betting lays out clearly. Multi-asset portfolios add another wrinkle: covariance between positions means you can’t just sum single-asset Kelly fractions and call it a day. Two “independent” edges that both blow up in the same risk-off event aren’t independent at all, and the formula doesn’t know that unless you feed it a proper covariance matrix.
How Do You Calculate Kelly From Real Trade Data?
Numbers make this concrete. Start with a clean binary bet, then move to something that resembles an actual trading record.
Binary example: Say you’re evaluating a setup with a 60% win probability and a payout of 1.5 to 1 (b = 1.5) on wins. Using f* = (bp − q) / b: p = 0.60, q = 0.40, so f* = (1.5 × 0.60 − 0.40) / 1.5 = (0.90 − 0.40) / 1.5 = 0.333. Kelly says risk a third of your bankroll. Nobody sane does that on a single bet, which is exactly why the fractional approach exists, covered next.
Trading-record example: Pull 100 trades from your journal. Say 55 were winners averaging $300, and 45 were losers averaging $200. That gives W = 0.55 and R = 300/200 = 1.5. Applying f* = W − (1 − W)/R: f* = 0.55 − 0.45/1.5 = 0.55 − 0.30 = 0.25.

Full Kelly says risk 25% of your account per trade on this setup, a number practitioner analysis of Kelly sizing flags as a textbook example of the formula producing an unworkable size.
Half Kelly reduces volatility substantially while retaining most of the theoretical growth rate, a tradeoff many traders prefer to manage drawdown risk effectively.
Fractional Kelly: How Much of the Formula Should You Actually Use?
Nobody serious runs full Kelly on live capital, and the math explains why. Growth rate near the Kelly-optimal fraction is flat, meaning you don’t lose much expected return by sizing down, while variance rises sharply as you push past that peak. Half Kelly captures most of the upside with meaningfully less bankroll volatility, which is the entire justification for fractional sizing rather than an act of excessive caution.
Fraction of Kelly | Typical use case | Volatility vs. full Kelly |
1/4x (full) | Simulation and backtesting only | Baseline |
0.5x (half) | Mature, well-validated strategies | Roughly half |
0.25x (quarter) | New live systems, smaller samples | Roughly a quarter |
0.1x | Highly uncertain or new instruments | Lowest, slowest to compound |
Pro Tip: Pick your fraction based on sample size, not confidence. Past 300 to 500 verified trades on a stable setup, moving toward half Kelly becomes reasonable.
Friction erodes the input numbers before you even get to the formula. Every dollar lost to spread, funding rates, or slippage against your execution benchmark lowers your realized R, which lowers f*. A strategy that looks like it has a 1.5R average payoff on a backtest might realize closer to 1.3R live once you account for VWAP-based execution slippage, and that gap alone can turn a reasonable Kelly fraction into an overleveraged one.
How Do You Estimate Win Rate and R Without Fooling Yourself?
Pulling W and R out of a messy trade journal takes more care than it looks. Here’s the process:
Export your full trade history, including every closed position, not a filtered “best setups only” subset.
Separate winners from losers and calculate the average dollar profit per winner and average dollar loss per loser.
Divide average winner by average loser to get R.
Divide the count of winning trades by total trades to get W.
Recalculate both figures on a rolling basis, monthly or quarterly, rather than treating them as fixed constants.
Raw win rates from small samples are almost always optimistic, because the trades that survive into your “proven setup” bucket were selected partly because they worked. Bootstrap resampling, drawing repeated random subsets of your trade history and recalculating W and R on each, gives you a distribution instead of a single overconfident number.
Sample size drives how much you should trust any of this. Guidance from trading-focused position sizing resources suggests treating anything under 50 trades as low-confidence territory, using something like a quarter of the computed Kelly fraction between 50 and 150 trades, and only leaning toward larger fractions past 500 verified trades on a stable strategy.
Under 50 trades: don’t trust the number, use a fixed small risk percentage instead.
50 to 150 trades: apply heavy shrinkage, roughly a quarter of computed Kelly.
150 to 500 trades: moderate shrinkage, roughly a third to a half of computed Kelly.
500+ trades on a stable, unchanged strategy: half Kelly becomes defensible.
Pro Tip: Keep a separate column in your journal for “setup version.” If you tweaked entry rules or stop logic, that’s a new sample, not a continuation of the old one, and mixing them poisons your W and R estimates.
Applying Kelly Across Multiple Trades and a Full Portfolio
A single trade’s Kelly fraction tells you little about what happens when you’re running five or six positions at once. The real objective across a portfolio is maximizing E[log(1 + X)], where X represents your combined return across all positions, not each one in isolation. Two trades that each look attractive on their own can combine into a much riskier bet than either suggests, if they’re likely to move together during the same market event.
Correlation is the variable that wrecks naive portfolio Kelly the fastest. A long Bitcoin position and a long Ethereum position aren’t two independent edges; they’re closer to one large directional crypto bet split into two tickets.
Practical adjustments that keep multi-position Kelly usable:
Shrink correlated positions toward a combined cap instead of summing their individual Kelly fractions.
Cap aggregate portfolio risk at a fixed ceiling, regardless of what the sum of individual f* values suggests.
Treat highly correlated instruments (same sector, same underlying macro driver) as one position for sizing purposes.
Rebalance position sizes as correlations shift, since correlation between assets is not stable over time.
Reserve a larger fraction of your risk budget for setups with genuinely independent triggers.
Converting a trade-level Kelly output into a portfolio weight means checking your total open risk against a hard cap before adding a new position, not just calculating that position’s f* in a vacuum.
What Drawdown Should You Expect From Kelly Sizing?
Full Kelly sizing comes with a well-documented cost: medium-term drawdowns that can exceed 50% of account value with meaningful probability, even when the underlying edge is real and stable. That’s the math working exactly as designed, since Kelly optimizes long-run growth, not smoothness of the ride getting there. Most traders can’t stomach that ride, and many blow up before the long run arrives.
Cutting to half Kelly reduces the depth and frequency of severe drawdowns substantially, without giving up most of the growth rate. That asymmetry, flat growth curve near the peak paired with steep variance beyond it, is the single best argument for running any live account below full Kelly.
A risk-control checklist worth running alongside any Kelly-based sizing model:
Hard per-trade risk cap, regardless of what the formula outputs (many traders cap individual trades at 1% to 2% of equity even when Kelly suggests more).
Daily loss limit that halts new trades once hit, independent of per-trade sizing.
Correlation cap across simultaneously open positions.
Volatility targeting that scales position size down automatically when realized market volatility spikes.
Drawdown tolerance is personal, and it should drive your fractional choice more than any formula output does.
Building a Repeatable Kelly Sizing Process
Turning Kelly from a spreadsheet exercise into something you run before every trade takes a short, boring checklist, followed consistently.
Pull the trade sample. Minimum 50 trades for the specific setup version you’re sizing, more if the sample includes different market regimes.
Calculate raw W and R using the method from the estimation section above.
Apply a shrinkage haircut, typically 20% to 30%, to both figures before computing f*.
Compute f* using f* = W − (1 − W) / R with the shrunk inputs.
Apply your fractional multiplier (0.1x to 0.5x depending on sample size and instrument leverage).
Convert to position size using stop distance: position size = (account equity × f* × fraction) ÷ (stop distance × dollar value per point).
Enforce hard caps that override the formula if it ever recommends more than your maximum per-trade or per-day risk limit.
A minimal pseudocode version for a live system might read:
recalculate W, R from last N trades (rolling window)
apply shrinkage: W_adj = W * 0.8, R_adj = R * 0.9
f_star = W_adj - (1 - W_adj) / R_adj
sized_fraction = f_star * fractional_multiplier
risk_dollars = account_equity * min(sized_fraction, max_per_trade_cap)
position_size = risk_dollars / (stop_distance * point_value)
If you’re building this in a spreadsheet instead of code, the core formulas map directly: win rate is COUNTIF(wins)/COUNT(all trades), average win and average loss come from AVERAGEIF on your P&L column split by sign, R is average win divided by average loss, and final risk-per-trade in dollars is account equity multiplied by your chosen fraction of f*. Divide that dollar figure by stop distance in points, then by the point value of your instrument, to get contract or lot size.
Pro Tip: Build the shrinkage and fractional multiplier as adjustable cells, not hardcoded numbers. You’ll want to tighten both after a losing streak and loosen them slightly after live confirmation, without rebuilding the spreadsheet.
Tools that automatically track what a crypto trading journal should track can remove most of the manual data wrangling from steps one and two, which is usually where this process breaks down for busy traders.
Common Mistakes and When Kelly Doesn’t Belong
The most common failure is treating a 30 or 40 trade sample as gospel and sizing full Kelly off it. Small samples produce wildly unstable W and R estimates, and a handful of lucky trades can inflate a mediocre edge into a fantastic-looking one that evaporates over the next 50 trades.
Other recurring mistakes worth naming directly:
Ignoring transaction costs and slippage when calculating R, which overstates the real edge.
Applying Kelly to undefined-loss instruments like naked options, where there’s no clean stop distance to size against.
Treating f* as a target to hit rather than a ceiling to stay under.
Assuming the edge is stable when the strategy, market regime, or instrument liquidity has clearly changed.
Stacking correlated positions without adjusting for the shared risk between them.
Kelly also assumes something close to independent, repeatable bets, an assumption that strains badly during trending or crisis markets when correlations spike and edges shift fast. If your strategy is genuinely non-stationary, meaning the edge itself drifts over weeks or months, a fixed-percentage risk model or volatility-targeting approach is often more robust than chasing a recalculated Kelly number every month.
Why I Treat Kelly as a Ceiling, Not a Sizing Tool
The single biggest misuse of Kelly I see is traders backing into the formula, plugging in a win rate and R they want to be true, then sizing up to match. Used correctly, Kelly is a discipline check: it tells you the maximum you could theoretically risk if your edge estimate is exactly right, which it never is. That’s why fractional Kelly isn’t a compromise, it’s the only version of this formula that survives contact with real, noisy trade data.
My practical defaults: new live systems start at quarter Kelly regardless of how good the backtest looks. Only after several hundred live trades confirm the edge does moving to half Kelly make sense. And no matter what the recalculated fraction says on a given week, a hard per-trade cap stays in place, because the formula has no idea your broker just widened spreads or your favorite setup stopped working three weeks ago.
Turning the Formula Into Enforced Position Sizes
Running Kelly correctly means solving a workflow problem as much as a math problem: pull clean trade data, shrink the estimate, apply a fraction, then enforce that size mechanically so you don’t override it emotionally mid-trade. That last step is where most manual processes quietly fail.

Discipline AI builds that workflow directly into the trading process instead of leaving it in a spreadsheet you forget to update. The platform ingests your trade history, tracks win rate and reward-to-risk automatically as new trades close, and applies position-size enforcement so a calculated fraction doesn’t get overridden by an impulse trade. Confidence scoring on each AI-generated setup gives you a live read on edge quality, trade autopsies show you exactly where realized R diverged from the plan, and execution analytics flag the slippage that quietly erodes the R you fed into your Kelly calculation in the first place. For a deeper walkthrough of building these frameworks, the AI Learning Center has templates for turning trade-log data into an enforceable sizing model. Start there if you want your next quarter-Kelly recalculation to run itself instead of living in a spreadsheet you open once a month.
Frequently Asked Questions
Is the Kelly Criterion good for trading?
It’s a useful ceiling for position sizing when you have a verified edge and a large enough trade sample, but running full Kelly live is rarely a good idea. Most traders get better results treating the formula’s output as a maximum and sizing down to a quarter or half of it.
What’s a realistic win rate to use in the Kelly formula?
Pull it from your own trade history over at least 50, ideally more than 150, closed trades on the exact setup you’re sizing. A win rate borrowed from a backtest or someone else’s strategy won’t reflect your actual execution and costs.
How is Kelly criterion trading different from fixed-percentage risk?
Fixed-percentage risk applies the same risk amount to every trade regardless of edge quality, while Kelly scales position size to the strength of the specific setup’s win rate and reward-to-risk ratio. Kelly can size up more aggressively on strong edges, which is exactly why fractional Kelly matters as a safeguard.
Does the Kelly Criterion account for trading fees and slippage?
Not directly. You need to fold fees, spread, and execution slippage into your R calculation before running the formula, since the standard version assumes clean, frictionless payoffs.
What fraction of Kelly should a beginner use?
Start at a quarter Kelly or lower, especially with fewer than 150 verified trades on the strategy. Move toward half Kelly only after live results confirm the edge holds up outside the backtest.
This article is general information, not a substitute for advice from a qualified financial advisor. Consult a qualified financial professional about your own circumstances before acting on anything here.
Sources
Traders who want to verify these formulas or run their own simulations have several primary sources worth working through directly:
Recommended

Comments